Moving Average
Advertisement
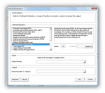
TraderCode Technical Indicators v.1 1
TraderCode is a library of technical analysis functions for used with Microsoft Excel. It allows you to create many types of technical indicators used in trading systems like Moving Average, Bollinger Bands, Average Directional Movement Index,
Advertisement

Bombay Stocks v.1.1.0.0
Bombay Stock Exchange (BSE) Daily Stock Picks based on 200 and 50 Day Moving Average. Bombay Stocks App is now updated for Mango Release for Windows Phone 7. Based on the feedback from current App users, we now show 100 Stock Picks (50 Up Trend and

Stockorama v.2.0.0.0
Stockorama 2.0 is now upgraded for Mango update! Stockorama 2.0 is now available with 100 free picks based on Moving Average. Data is updated on a daily basis. Stock picks are based on 200 Moving Average with additional 50 Moving Average data shown

Stocks 50-200 v.1.5.0.0
Stocks 50-200 quickly allows you to get 4 key indicators about the stocks that you wish to track: 1. Last Price 2. Change in Price ($ and %) 3. 50 Day Moving Average and 4. 200 Day Moving Average The "Stocks 50-200" was created as I could not
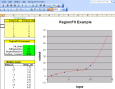
Data Curve Fit Creator Add-in v.2.70
Adds data curve fitting, interpolation and data smoothing functions to Excel. Functions include polynomial fits, several types of splines, and local regressions. Filters include moving average, Gaussian smoothing and median filtering.
M.I.R. - Moving Image Retoucher v.1.3.2
HS-ART presents the moving image retouching tool M.
SQLRollingStats v.1.0.0.0
CLR-based function library for SQL Server that adds 31 windowed / cumulative functions that can be used directly in queries.
Tradingbasis - Tools for Amibroker
The Tradingbasis Tools are designed to improve your trading performance significantly and to make it much easier than ever before to find profitable trading patterns. You can find your favorite patterns with just a few mouse clicks. Every market and every
Financial Charting Component
Financial Charting Component (standard edition) is written in 100 percent C sharp with cutting edge .NET technology. In addition to its striking visual effects, it has a variety of features including charts with pan and zooming charting features: Point
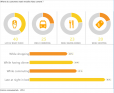
TeeChart for .NET v.2018
TeeChart for .NET Charting Controls offer full set of Chart types and a combination Gauge types for dashboard applications. Support Windows Forms, ASP.NET Core MVC, HTML5, WPF, UWP and Xamarin iOS, Android & Forms.
Portfolio Optimization v.5.0
The Portfolio Optimization template optimizes capital weightings for portfolios of financial investments that maximizes return and minimizes risk. Technical analysis constant parameters are optimized to maximize back tested returns on signal trading.